Social Engagement Metrics That Matter - Measuring, Tracking, and Reporting FTW
- February 13, 2014
- SMO
Let's be real here, measuring your social efforts is a pain in the butt. I mean, there are tons of metrics to track, and data to look at, but actually knowing if you're making an impact to the organization, that's a bit trickier. Right? It's simple to track followers and see which platforms send you traffic, but how do you know that you're meeting your goals? How do you make sure everyone understands social's impact on the organization?

Follower counts are boooooooring.
These are the types of questions I often hear when people are grasping with "proving their worth" or getting management and other team members on board with making social a focus. It's so easy to get caught up in doing the things, that you sometimes forget to measure and understand why the things need to be done.
Today I want to walk you through the process we use here at Moz for measuring our social efforts. This is a process we're constantly working to improve, and we have just recently added new metrics and changed our goals a bit. It's something that you don't do once, then set aside.
Social Media Goals
Before I dig into the specific metrics, it's important to take a look at your business goals. At Moz, we use the OKR (Objectives and Key Results) system throughout the organization. This helps to ensure that we're all measuring things in a similar way and that we're all working toward meeting and impacting the company's overall objectives.
Since social media is pretty top-of-the-funnel, you'll often have goals around increasing engagement and traffic to your site, or growing community and improving customer service, and not as much around increasing sales or subscriber numbers. Moz has always been a very customer/community-centered organization, so while the community team will always be focused on customer service and expanding the community, on a quarterly basis we additionally focus on helping to meet the goals of the marketing team as a whole.
Let's take a look at one of these examples:
Marketing Objective: Increase Site Traffic, Engagement, and Customer Flow through Site Funnel
Key Result: Improve Non-paid traffic to the site from all sources by 25% by end of Q2
Social roadmap: Increase engagement with community by 5% on Social channels in order to increase traffic from social by 15%
Engagement Metrics That Matter
Ok, so you know how you want to use social media to reach goals for your organization. Engagement is a great goal, because it can impact the business by increasing traffic, growing brand awareness, talking with community members, showing your voice. But "engagement" isn't a simple number like followers. It's a fuzzy word we like to use to mean "interactions with your brand." Plus, every social channel is completely different, and engagement isn't the same for each, so how can you measure it? On top of that, how are you going to gather all the information? Which tools will you use, or do you have to go to each network to grab the info?
But what if I told you that actually all the social networks (including your blog!) really do have the same engagement metrics? Several years ago, Avinash Kaushik wrote a post where he touts the best social media metrics are Conversation, Amplification, Applause, and Economic value.
We've adopted this method of engagement tracking, and actually use this not only for our social sites, but also for engagement on the blog and in other areas of the site. Let me explain what each of these means for different platforms, and how they're really all the same. 🙂
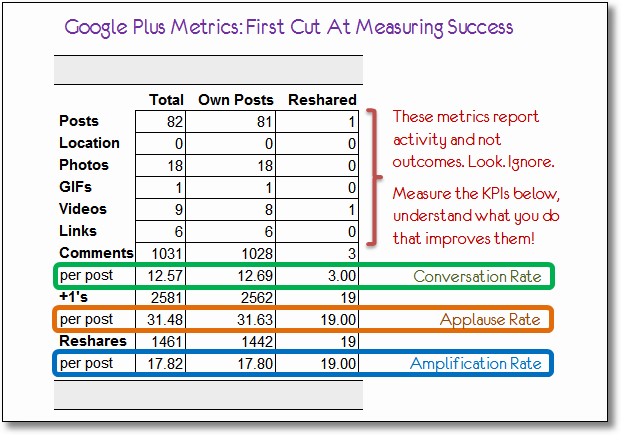
Conversation rate – This one is fairly straightforward in that it's based on the number of conversations per post. On Twitter, this is replies to a tweet, or on Pinterest, Facebook, and Instagram, it's a comment on the pin, post, or photo.
Amplification rate – Any time a post is retweeted or re-shared, it's being amplified. All the networks allow you to do this, so think of this one as the number of re-pins, retweets, or reshares of a particular post.
Applause rate – Every social network out there has an "easy" touch point to show appreciation, or applause, if you will. Twitter has favorites, Facebook has likes, Google+ has plusses, heck even most blogs (such as our own) have thumbs up or up-votes. So the applause rate is based on the number of "likes" each post gets.
Economic value – This is the sum of short- and long-term revenue and cost savings. Now, I have to be honest, we don't have the economic value part all worked out yet for the community side of things yet. But it will be a focus over the next few months to have things set up correctly.
Relative Engagement Rates – This is something that actually gets me all giddy. 😀 So, you have all these engagement metrics, but what do those numbers even mean? How can you compare the conversation rate on Facebook with the conversation rate on Instagram? This is where the relative rates come in, think of it as the average number of conversations happening per post, per follower (fan, encircle, etc.).
Think about it this way, using the relative engagement rates, you can start to compare followers to followers on different networks. Now, Facebook and Twitter (or Pinterest, or G+, or Instagram, etc.) are obviously not the same, but if you can determine the engagement rate per follower, per channel, you can then work to improve those rates accordingly.
This way, when you increase your follower count, you can also focus on sustaining (which is actually an improvement all on its own) or improving the engagement rate per follower. So you can show your boss or client, that not only have you increased followers, you've also increased engagement per follower. And at this point, the traffic to the site from social has probably increased as well.
Ok, these numbers aren't rocket science, and honestly they're not that hard to get, I mean it's mostly math. But the very smart folks over at TrueSocialMetrics have made it super easy on all of us by essentially creating the tool that Avinash pleaded for in his initial post. (Also, bravo on seeing a need and making it happen!)
How to track them
As I mentioned previously, you could go about grabbing these numbers on your own and calculating them by hand… but why in the world would you do that when TrueSocialMetrics has already done all the work for you?
Your first step is to run over to TrueSocialMetrics and sign up for a free account. With the free plan you get 12 social networks and a month of data history. I personally prefer the "small" plan which is only $30/month and gives you a year of data history. (FYI, we have no affiliation with them, we're just a happy customer!)
Once you sign up, you'll add connections to all your social networks, including your blog, and then start calculating the data right away. The initial dashboard looks something like this:

Holy numbers, Batman! Remember, right now we're just at the point of tracking the data, we'll make this look a bit prettier in the next step.
Here at Moz, we capture our metrics on a weekly basis, and then send a monthly email to the entire staff, showing how we did during the previous month. We've toyed with a number of ways to show this data, and make it clear what's moving the needle.
Every Monday morning, Megan logs into TrueSocialMetrics and grabs the following numbers for each channel for the previous week, and adds them to our spreadsheet:
- Posts
- Replies
- Shares/RTs
- Favorites/Likes/Plusses
- Conversation Rate
- Amplification Rate
- Applause Rate
- Channel Growth
- Visits from each channel

What I like about this is that you're essentially using this for data storage, and anyone can do it. It's not a method that only one person knows how to do, it's a simple process of adding numbers to a spreadsheet. Then you'll make something a bit easier to digest that you send around to the rest of the team, or to your client.
How to report it
Having the data and doing something with the data are two different things. Not only do you need to use the information to help meet your goals, but there are always other folks who are dying to know the ROI of what you do each day. So how can you take these metrics, and report them to the team in a way that is easily digestible? In a way that shows performance over time and helps everyone understand what's going on from a social perspective.
Community action plan
The first thing we did, was to create a Community Action Plan, which is a quick and easy way to see where we're at with reaching our goals at any given time. It shows our weekly KPIs, the baseline for each metric, the percent increase for this current period, our goal by the end of the period, and where we're at with that goal.

On a weekly basis we grab the data, throw it in the spreadsheet, and then our action plan magically shows us how we're doing against our goals. I <3 magic.
You can download a sample version of spreadsheet that we use for this here:
Sample Social Media Action Plan
Monthly email
In addition to having this easy-to-read dashboard, we also send out a monthly email to the entire staff which shows our engagement rates over the past six months, traffic from the social channels, as well as a few other community metrics we look at that aren't social specific. We lovingly call this email the "Community Chronicle." 🙂
Here's a taste of what it looks like this:

Notice the downward spiral of Facebook engagement and traffic, while Twitter continues to soar? This is a trend we've been noticing for the past few months, ever since Facebook made some algo changes to their feeds that shows less and less updates from brands. *insert sad face here*
But this is exactly the kind of trend we want to know about, so we can react to it. We've been testing various ways of increasing engagement on Facebook, and we've seen a slight up-tick. We'll all surely be watching this over the next few months to see if we can get those numbers back up organically, or if we'll be forced to pay the man! The Facebook man that is.
What's next?
Well, now it's your turn to take action. Capturing the data is the easy part, the tough part is to do something with it. You'll need to decipher the trends, determine when to make changes, what works, and what doesn't work. Since it can be different for every organization, I'd love to see how you set up your action plans and if you add other metrics to it. If you do create one, send it over, I'll add a link in this post.
Social media can be a tough one to explain to the boss/client, but it doesn't have to be. Put it into simple terms and track it over time. Let me know how it goes!
Article Reference : Search Engine Journal
About Us
We are a digital marketing company with a focus on helping our customers achieve great results across several key areas.
Request a free quote
We offer professional SEO services that help websites increase their organic search score drastically in order to compete for the highest rankings even when it comes to highly competitive keywords.
Subscribe to our newsletter!
More from our blog
See all posts

Recent Posts
- sfdfdsfd November 15, 2022
- The Blend of BlockChain & Artificial Intelligence in Technology September 8, 2018
- OneApollo September 4, 2018


Pingback: cialis rebate
Pingback: 150 mg viagra
Pingback: cialis discount card
Pingback: is viagra covered by medicaid
Pingback: take a look at the site here
Pingback: mobviagrweb.com
Pingback: ivermectin resistance
Pingback: ivermectin shampoo
Pingback: ivermectin pancreatic cancer
Pingback: ivermectin covid treatment
Pingback: will ivermectin kill tapeworms
Pingback: durvet ivermectin horse paste
Pingback: ivermectin pour on for sheep
Pingback: 1
Pingback: duloxetine patient assistance program
Pingback: escitalopram
Pingback: medications hydrochlorothiazide
Pingback: duloxetine is generic for what drug
Pingback: how long does it take lyrica to get out of your system
Pingback: lexapro withdrawal symptoms list
Pingback: quetiapine 100 mg street value
Pingback: forgot to take sertraline for one day
Pingback: prozac fluoxetine
Pingback: omeprazole osteoporosis
Pingback: medication atorvastatin
Pingback: side effects from amlodipine
Pingback: regcialist.com
Pingback: pricing of prescription drugs
Pingback: how much viagra to take first time
Pingback: buy viagra without a doctor prescription
Pingback: the drug store pharmacy columbus ohio
Pingback: how long does cialis take to work
Pingback: what exactly does viagra do?
Pingback: canadian online pharmacies that do not require a prescription
Pingback: is it illegal to buy prescription drugs from canada
Pingback: rx express pharmacy navarre fl
Pingback: generic cialis september 2018
Pingback: eu pharmacy online
Pingback: cutting cialis in half
Pingback: generic cialis overnight delivery
Pingback: cialis black reviews
Pingback: cialis for bph side effects
Pingback: thesis coaching
Pingback: writing a graduate thesis
Pingback: cialis 10mg erfahrung
Pingback: viagra prices walmart
Pingback: cialis black
Pingback: generic cialis 20 mg online
Pingback: generic cialis 10mg
Pingback: cialis 20mg overnight
Pingback: cialis on line pharm
Pingback: viagra
Pingback: canadian online pharmacies legitimate
Pingback: canadian pharcharmy online fda approved
Pingback: anti viral
Pingback: pharmacy online
Pingback: online canadian pharmacies
Pingback: how much is viagra
Pingback: i am a woman and i took viagra
Pingback: how long does it take viagra to work
Pingback: otc viagra
Pingback: cialis generic name
Pingback: cialis professional
Pingback: cialis for sale
Pingback: buy cialis online safely
Pingback: best thesis writing service
Pingback: business thesis topics
Pingback: what is the best research paper writing service
Pingback: someone to write my paper
Pingback: best online essay writing services
Pingback: essay writing help
Pingback: dissertation writing assistance
Pingback: https://customessaywriterbyz.com
Pingback: what are the best essay writing services
Pingback: http://aaa-rehab.com